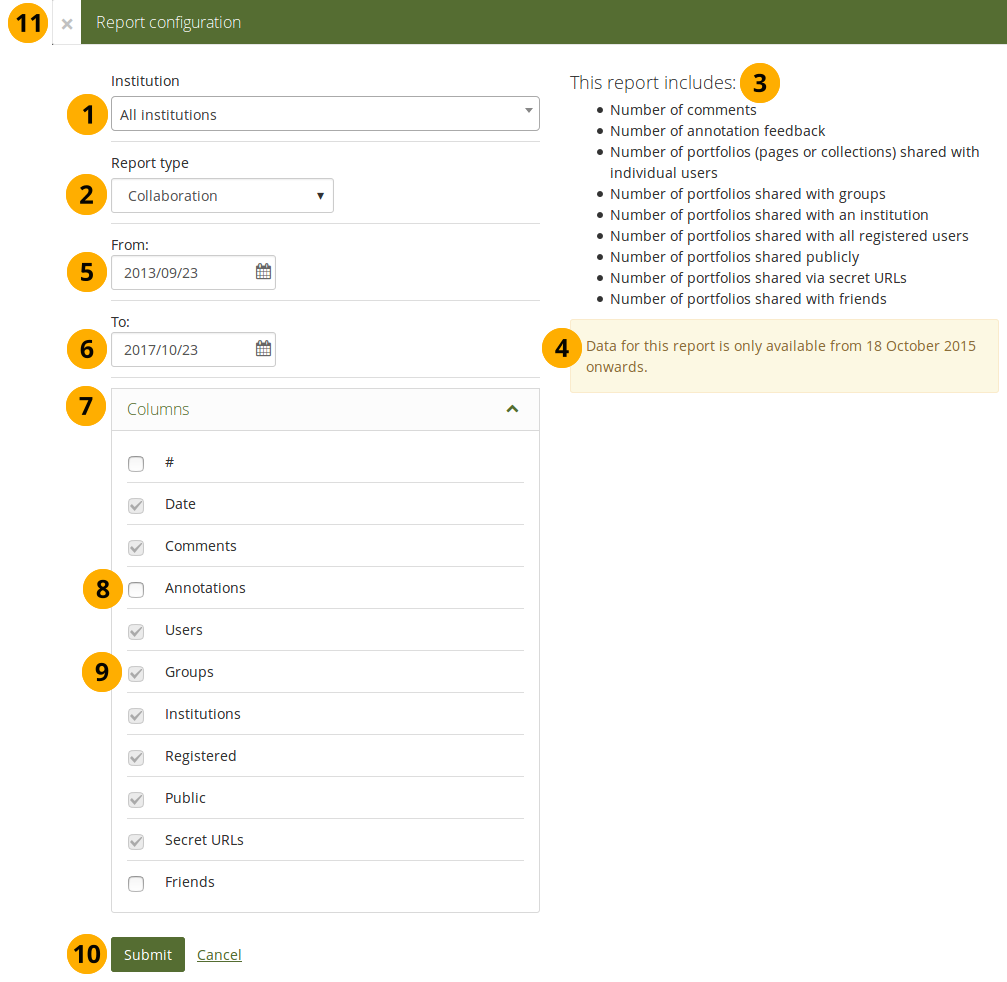
Institution: Select the institution for which you want to run the report.
Notitie
Site administrators see all institutions and the option “All institutions”, which is the site level. Institution administrators only see reports for the institutions in which they are an administrator.
Report type: Select the report that you want to display. The categories are:
Content
Groups
Institutions
People
This report includes: This section details what information the report includes.
The date of the first event logged in the database that can be used for the report. If the report is run for prior dates, the data will be incomplete.
Notitie
Mahara only detects the first date, but not if event logging had been turned off for a period of time afterwards.
From: Select the start date for your report by clicking into the field and selecting it via the calendar.
To: Select the end date for your report by clicking into the field and selecting it via the calendar.
Notitie
You can only view reports for data that is still in the database on the site. If data was deleted or not yet collected for certain reports to show data, no data can be displayed.
If you want to report over today in “To”, you need to choose tomorrow’s date as the date assumes the report is up to midnight of the previous day right before the start of today.
Columns: Click the icon to show the columns that you can select or deselect to tailor the report for this session. The icon is displayed when the panel is open.
Tick the checkbox next to an item that you want to display as additional column in your report.
You can’t deselect certain columns as they display the minimum information for the selected report.
Click the Submit button to display results for your report, or click Cancel to abort any changes to your report.
You can also click the Close icon in the top left-hand corner of the modal window to cancel your action without saving any changes.
This report is only available on the site level and can’t be selected by institution administrators.
The group report provides information about the groups that are on the site. For each group you can see:
ID
Name
Number of members
Number of pages
Number of shared pages
Number of comments on group pages and artefacts
Number of comments on pages and artefacts shared with the group
Number of forums
Number of forum posts
Notitie
This report requires event logging to be turned on for the entire site. Since events cannot be put into the database in retrospect, correct data is only collected from the time the full event logging has been turned on.
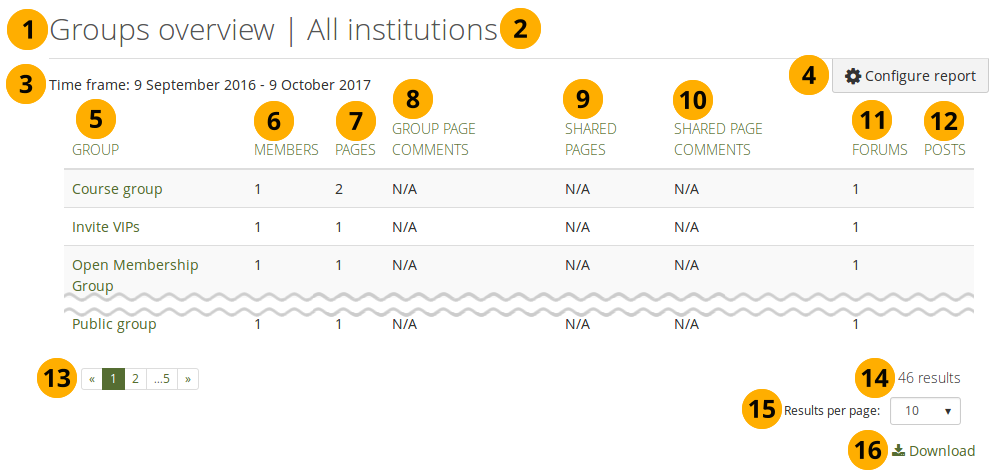
Institution that was selected for the report. If it says “All institutions”, then the report is over the entire site.
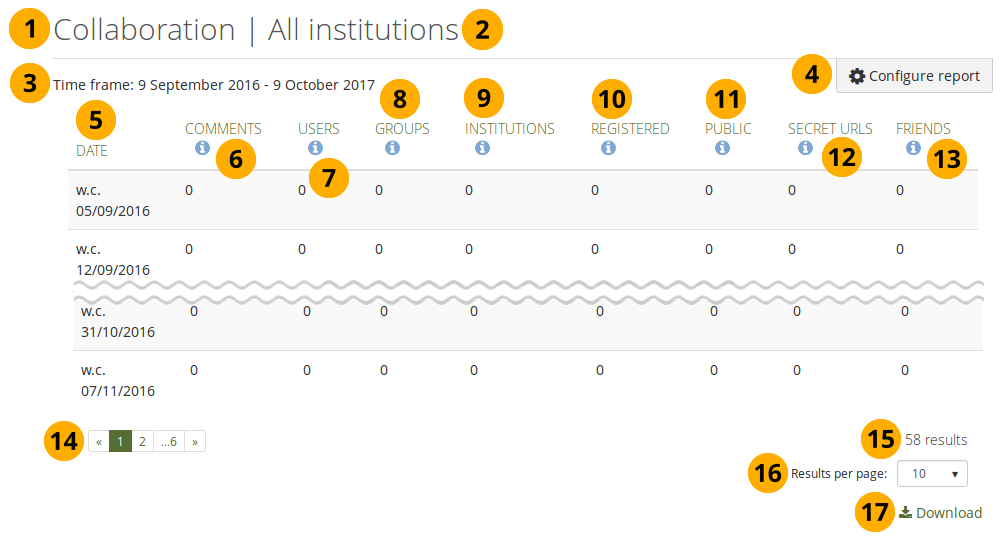
Time frame over which is being reported.
Click the Configure button to change the report settings.
Group: Title of the group.
Members: Number of members in the group.
Pages: Number of pages in the group.
Group page comments: Number of comments on group pages and artefacts.
Shared pages: Number of pages that have been shared with the group.
Shared page comments: Number of comments on pages and artefacts shared with the group.
Notitie
This only takes into account comments that were made after the page was shared with the group as that event could not have been logged prior to that.
Forums: Number of forums in the group.
Posts: Number of forum posts in the group.
Paginator to jump to additional results.
Total number of results.
Results per page: Change how many results you want to display per page.
Click the Download icon to download the report as CSV file.
Notitie
“N/A” (not available) in any of the columns indicates that there is no data available yet. This is an indicator that the information was not yet recorded via the event logging.
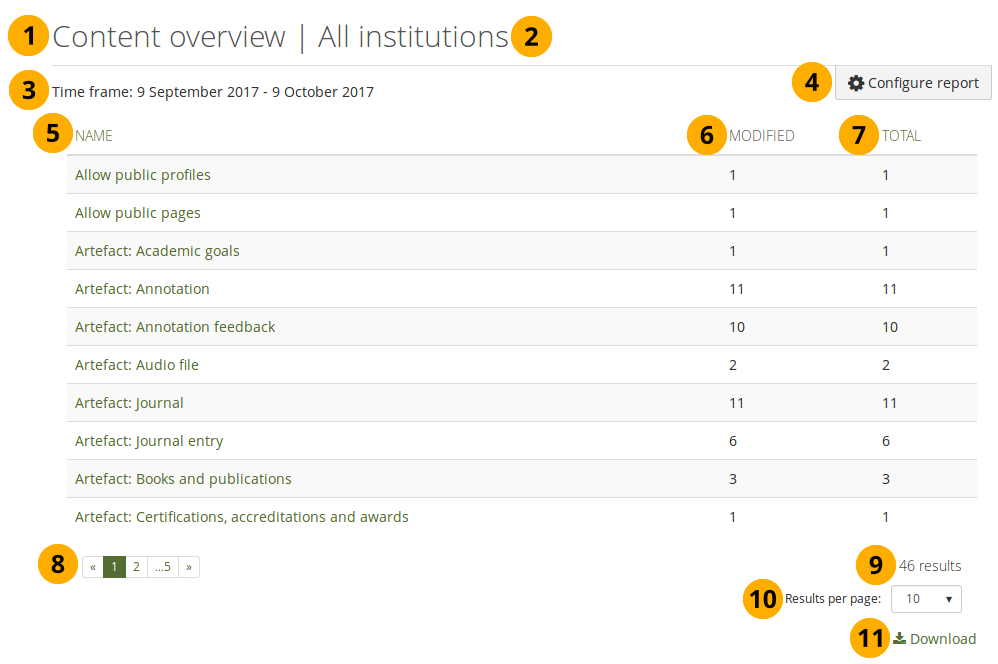
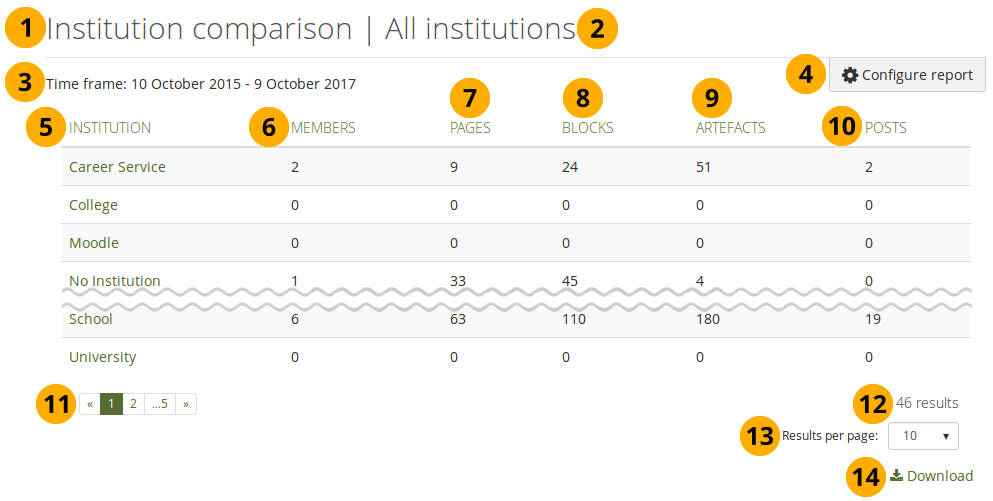
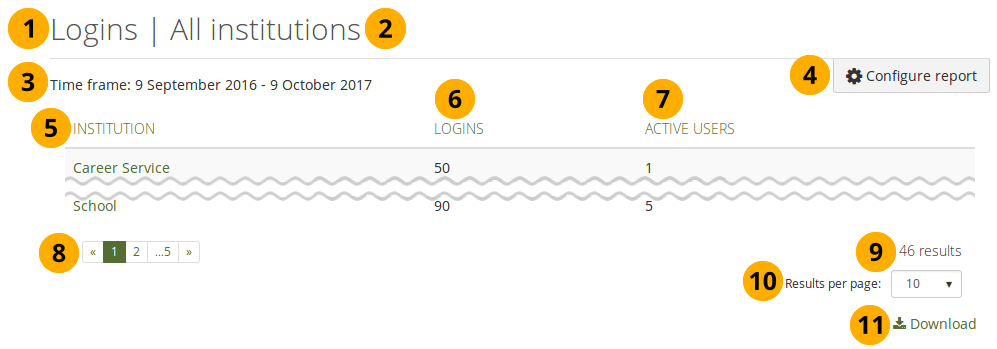
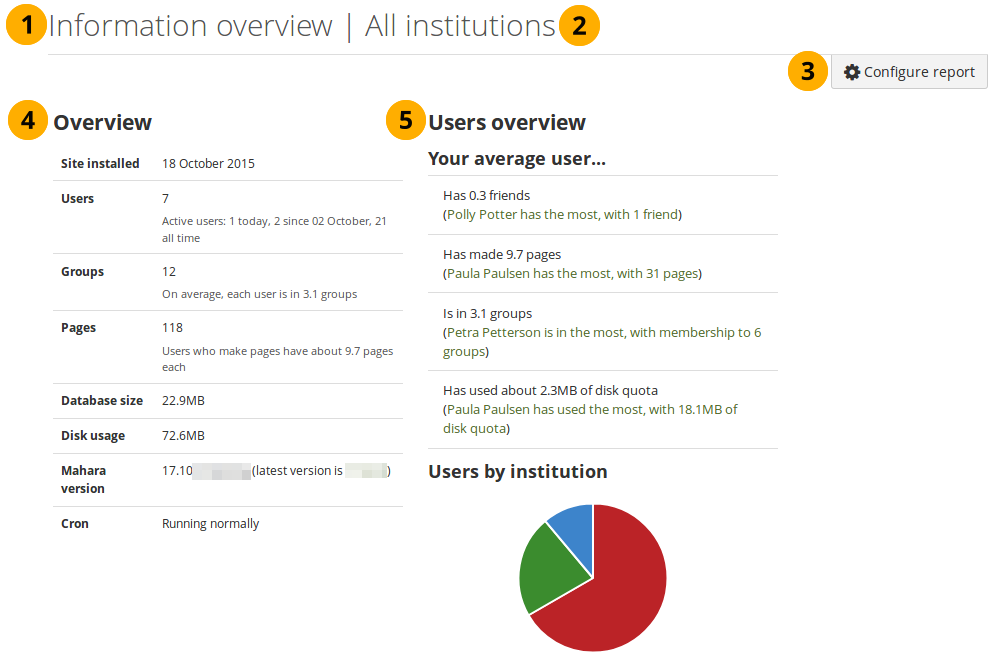
Institution that was selected for the report. If it says “All institutions”, then the report is over the entire site.
Click the Configure button to change the report settings.
Overview: Some information about the site or institution:
Site installed / Institution created: Installation date of your site. If you view this report for an institution, the institution creation date is shown, i.e. the first time a member was added to the institution.
Users: Number of
registered users, i.e. everybody who has an account
active users, i.e. users that have at least logged in once and have done something
Groups: Number of groups and average group membership of a user. This is only available for “All institutions”.
Pages: Number of pages and average pages per user with pages.
Database size: Size of your database on the server. This is only available for “All institutions”.
Disk usage: The amount of disk space your Mahara installation or institution uses.
Mahara version: Version number of Mahara and the latest stable release. This is only available for “All institutions”.
Cron: Information on whether cron is running or not. If it says “Cron is not running”, please check it. It may be running partially. This is only available for “All institutions”.
Additional information and graphs are available for:
Average user in terms of friends, pages, group membership, and use of space.
Users by institution. This is only available for “All institutions”.
Pages overview: Most frequently used blocks and types of pages.
Groups overview: Number of groups by group type and access type. This is only available for “All institutions”.
Growth trend: Graphical representation of all users and pages over time.
The collaboration report shows the level of engagement and collaboration that is happening on Mahara in regard to personal portfolio pages and collections:
Number of comments on pages and artefacts
Number of annotation feedback
Number of portfolios (pages or collections) shared with individual users
Number of portfolios shared with groups
Number of portfolios shared with an institution
Number of portfolios shared with all registered users
Number of portfolios shared publicly
Number of portfolios shared via secret URLs
Number of portfolios shared with friends
Notitie
This report requires event logging to be turned on for the entire site. Since events cannot be put into the database in retrospect, correct data is only collected from the time the full event logging has been turned on.
If you do not turn on event logging and have Elasticsearch running, you can’t see this report.
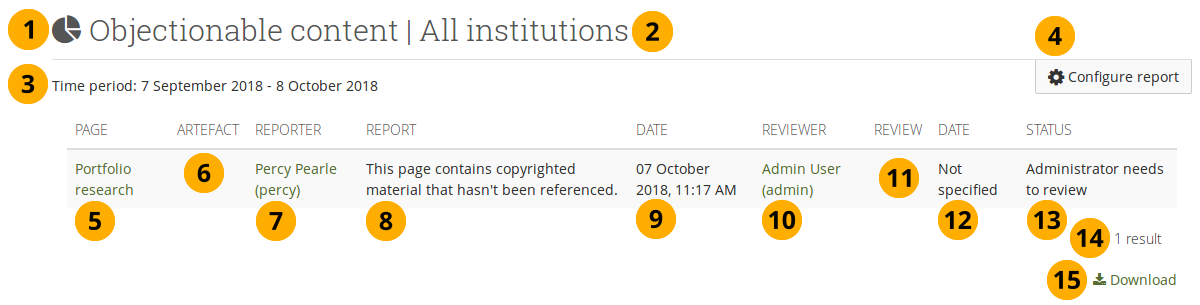
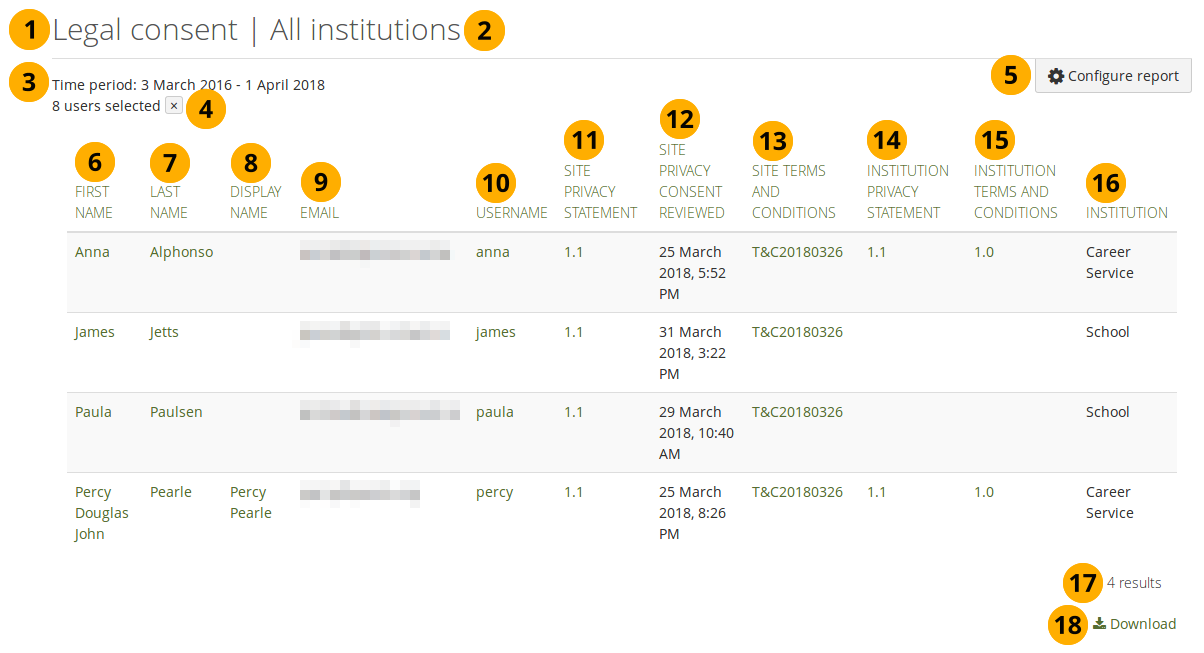
When the site requires people to accept the terms and conditions and privacy statement, this report tracks when people consented to these legal statements.
Institution that was selected for the report. If it says “All institutions”, then the report is over the entire site.
Time frame over which is being reported.
Number of selected users for the report if it is not over an entire institution. Click the Remove filter button to report over all people in the chosen institution.
Click the Configure button to change the report settings.
First name: First name of the user.
Last name: Last name of the user.
Display name: If the user chose to set a display name, it is displayed here.
Email: Email address of the user.
Username: Username of the user.
Site privacy statement: Version number and link to the privacy statement that the user has a greed to.
Site privacy consent reviewed: Date when the user agreed to the site privacy statement.
Site terms and conditions: Version number and link to the terms and conditions that the user has a greed to.
Institution privacy statement: Version number and link to the institution privacy statement that the user has a greed to.
Institution terms and conditions: Version number and link to the institution terms and conditions that the user has agreed to.
Institution: Name of the institution in which the user is a member.
Total number of results.
Click the Download icon to download the report as CSV file.
Notitie
You can also display the dates when the site terms and conditions and the institution legal statements were consented to.
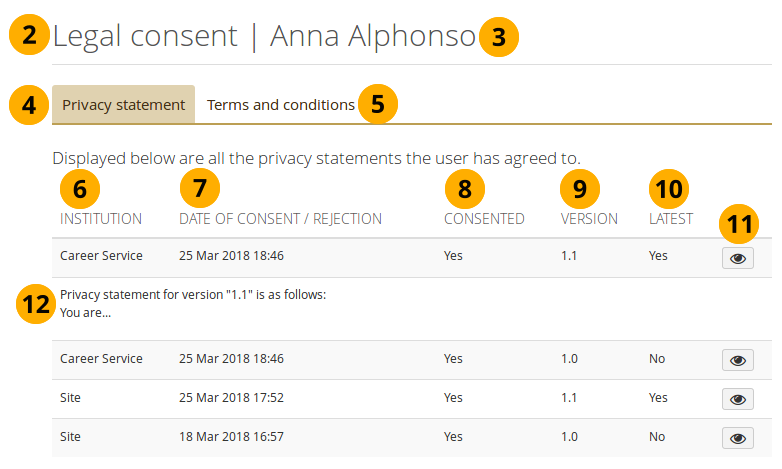
When you click on the version number of any of the legal statements, you are taken to a report for an individual’s consent history.
Run the legal consent report and click a version number of any of the agreements that a the person consented to.
Title of the report.
Name of the person whose consent history you are viewing.
Click “Privacy statement” to see all the privacy statements to which the user has agreed to at some point.
Click “Terms and conditions” to see all the terms and conditions to which the user has agreed to at some point.
Institution: List of the institutions that have an agreement impacting the user. “Site” always means the site agreements that everyone needs to review.
Date of consent / rejection: The date when consent was given or rejected.
Consented: “Yes” or “No” depending on the decision of the user.
Version: Version number of the agreement to which the user needed to respond.
Latest: “Yes” or “No” indicating which is the current applicable agreement.
Click the View button to see the text of the agreement that you want to review.
When the site administrator turned on the logging of masquerading sessions, they are reported in this report. If full event logging is turned on, masquerading sessions are recorded as well.
The report shows:
Name and username
Reason for the masquerading session
Administrator who masqueraded
Start time of the masquerading session
You can display masquerading sessions for all people on the site or your chosen institution. Alternatively, you can select people on Administration menu → Users → User search and report only over them:
On the User search page, select the people for whom you wish to see the masquerading sesions report and click the Get reports for selected users button. You are taken into the Reports section.
Click the Configure report button.
Report type: Select “Masquerading sessions”.
From: Choose your start date.
To: Choose your end date or leave it at today’s date.
Columns: Select the columns that you wish to display in the report.
Click the Submit button.
The report shows the information for the selected users.
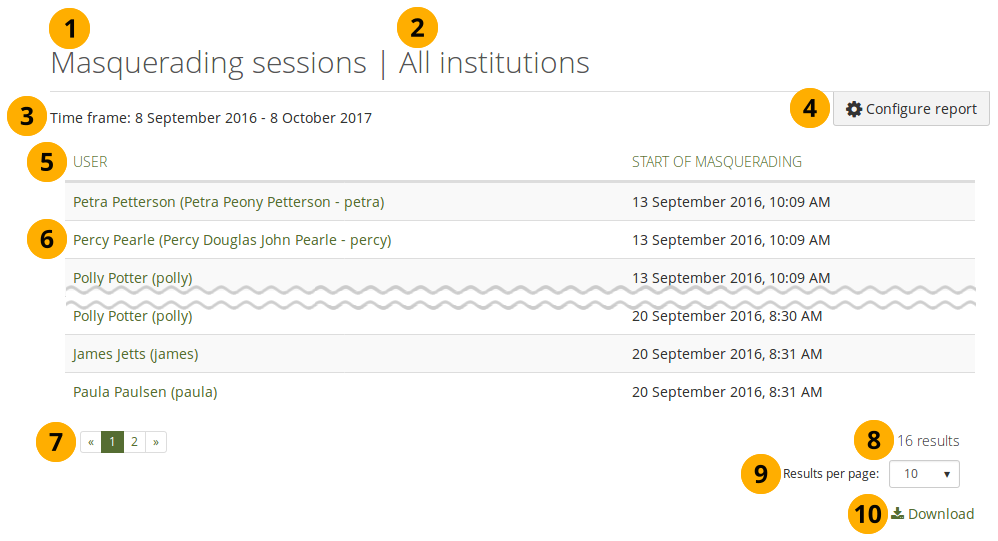
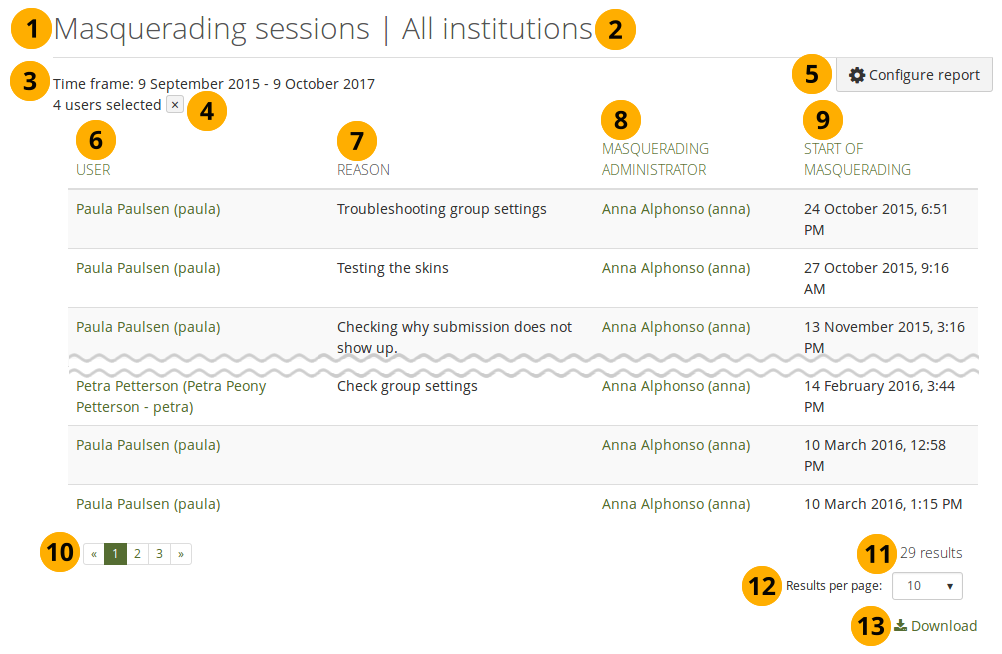
Institution that was selected for the report. If it says “All institutions”, then the report is over the entire site.
Time frame over which is being reported.
Number of selected users for the report if it is not over an entire institution. Click the Remove filter button to report over all people in the chosen institution.
Click the Configure button to change the report settings.
User: Person who has been masqueraded as.
Reason: Reason for the masquerading. This is only displayed if the administrator was required to provide one.
Masquerading administrator: The administrator who initiated the masquerading session.
Start of masquerading: Date and time when the administrator started to masquerade as the user.
Paginator to jump to additional results.
Total number of results.
Results per page: Change how many results you want to display per page.
Click the Download icon to download the report as CSV file.
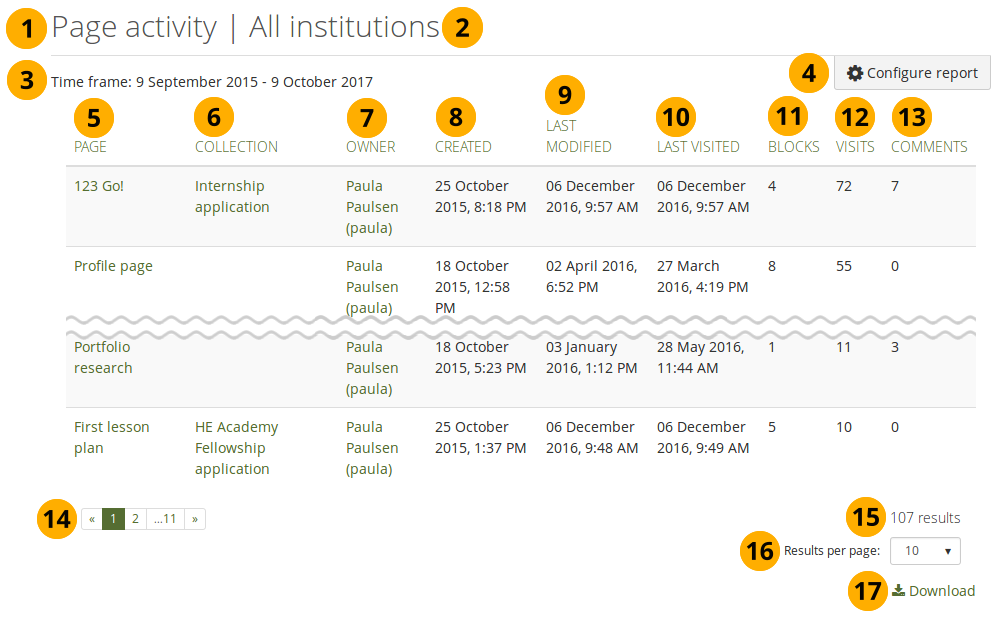
The page activity report gathers data about a page itself and its content:
Page title
Title of the collection to which the page belongs (if any)
Page owner
Creation date
Last modification date
Date, when the page was last viewed
Number of blocks included in the page
Number of visits to the page
Number of comments on the page
Notitie
This report requires event logging to be turned on for the entire site. Since events cannot be put into the database in retrospect, correct data is only collected from the time the full event logging has been turned on.
If you do not turn on event logging and have Elasticsearch running, you can’t see this report.
You can view all the portfolios that have been created by people on the site or in a particular institution and with whom they have been shared. This facilitates troubleshooting when people cannot view pages of others and the administrator would otherwise have to log in to the user account to check page permissions.
The report displays:
Portfolio owner
Title of the portfolio
Number of pages in the portfolio
Access list, i.e. who has permission to view the portfolio
You can display the portfolio access for all people on the site or your chosen institution. Alternatively, you can select people on Administration menu → Users → User search and report only over them:
On the User search page, select the people for whom you wish to see the portfolio access report and click the Get reports for selected users button. You are taken into the Reports section.
Click the Configure report button.
Report type: Select “Portfolio access”.
From: Choose your start date.
To: Choose your end date or leave it at today’s date.
Click the Submit button.
The report shows the information for the selected users.
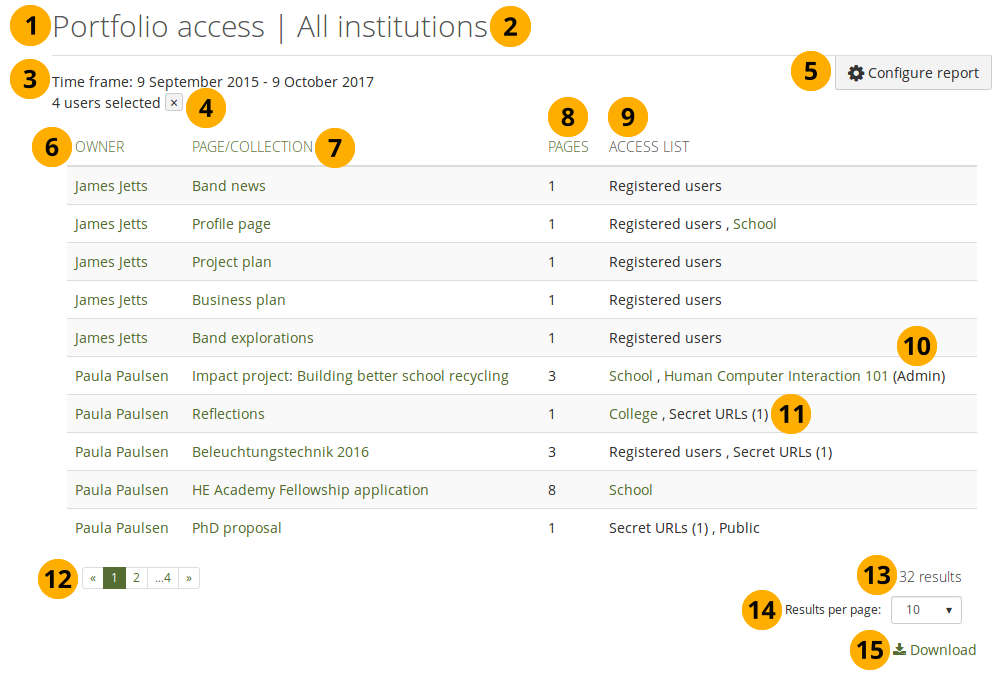
Institution that was selected for the report. If it says “All institutions”, then the report is over the entire site.
Time frame over which is being reported.
Notitie
The time frame here refers to pages or collections created within the start and end dates.
Number of selected users for the report if it is not over an entire institution. Click the Remove filter button to report over all people in the chosen institution.
Click the Configure button to change the report settings.
Owner: Person who is the owner of the portfolio.
Page / collection: Title of the portfolio.
Pages: Number of pages within a collection.
Access list: Listed are who has access to the portfolio.
If a portfolio has been shared with only a certain role within a group, that is stated.
Number of secret URLs created for the portfolio.
Paginator to jump to additional results.
Total number of results.
Results per page: Change how many results you want to display per page.
Click the Download icon to download the report as CSV file.
Notitie
Though all pages, collections and groups are linked, you may not have direct access to them if you are not on the access list or a member of the group yourself.
This report displays information about a user and their level of activity on the site during the selected time frame:
User information
Number of artefacts created or modified
Number of pages created
Number of collections created
Number of groups created
Number of logins
Number of actions (create and modify an artefact, forum post, personal pages and collection, group pages and collections, comments, page views)
Last login
Last activity
Notitie
This report requires event logging to be turned on for the entire site. Since events cannot be put into the database in retrospect, correct data is only collected from the time the full event logging has been turned on.
You can display the user activity for all people on the site or your chosen institution. Alternatively, you can select people on Administration menu → Users → User search and report only over them:
On the User search page, select the people for whom you wish to see the user activity report and click the Get reports for selected users button. You are taken into the Reports section.
Click the Configure report button.
Report type: Select “User activity”.
From: Choose your start date.
To: Choose your end date or leave it at today’s date.
Click the Submit button.
The report shows the information for the selected users.
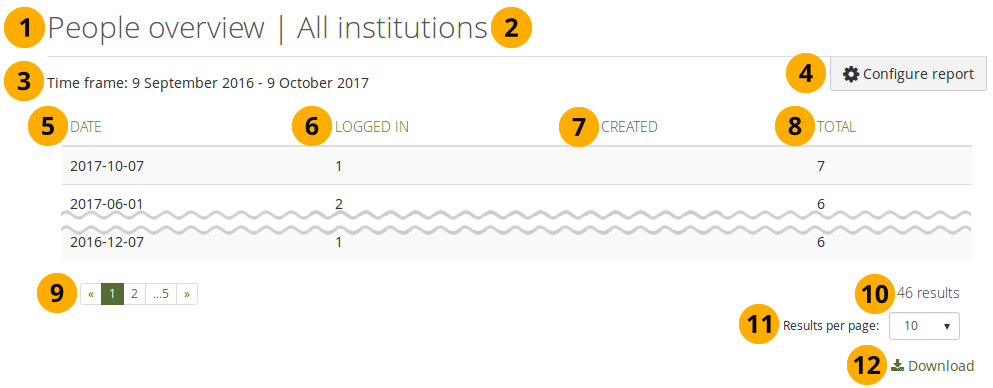
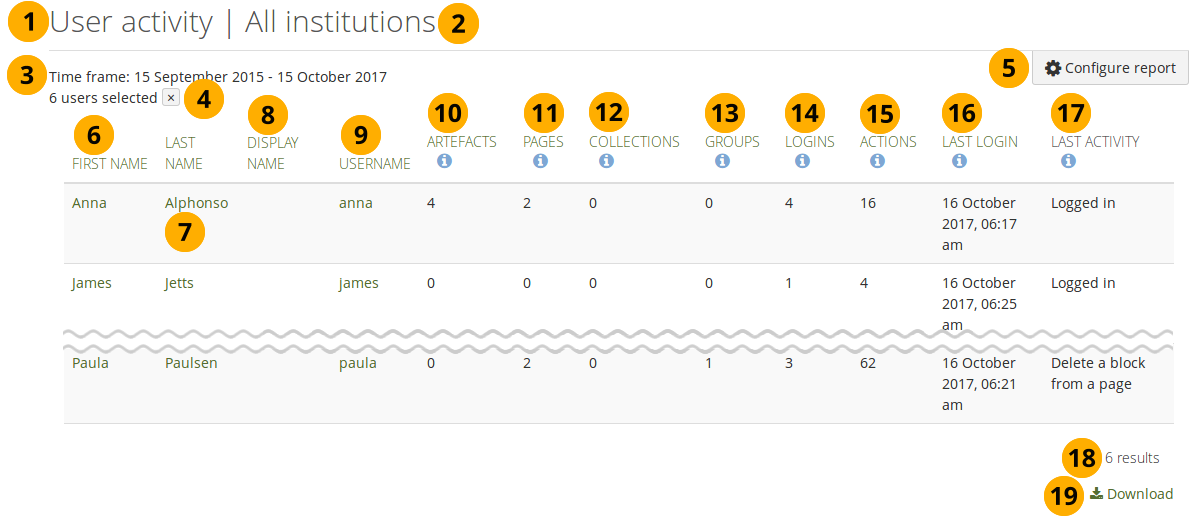
Institution that was selected for the report. If it says “All institutions”, then the report is over the entire site.
Time frame over which is being reported.
Notitie
Activity is shown for people who were logged in during this time frame.
Number of selected users for the report if it is not over an entire institution. Click the Remove filter button to report over all people in the chosen institution.
Click the Configure button to change the report settings.
First name: First name of the user.
Last name: Last name of the user.
Display name: If the user chose to set a display name, it is displayed here.
Username: Username of the user.
Artefacts: Number of artefacts created or updated.
Pages: Number of pages created during the time frame.
Collections: Number of collections created during the time frame.
Groups: Number of groups created during the time frame.
Logins: Number of total logins on the site.
Actions: Number of actions the user has taken on the site, i.e. created and modified an artefact, wrote a forum post, created and modified personal pages and collection, created and modified group pages and collections, wrote comments, viwed pages.
Last login: Date and time when the user was in their account last.
Last activity: Last activity in the user’s account.
Notitie
Masquerading sessions are listed as activity. They do not count as a last login though.
Total number of results.
Click the Download icon to download the report as CSV file.
The user details report provides basic account information about a person and is well suited for exports if you want to update accounts via a CSV file:
Username
Email address
First name
Last name
ID number
Display name
Remote username
Quota used
Last login
Number of probation points
You can display the user details for all people on the site or your chosen institution. Alternatively, you can select people on Administration menu → Users → User search and report only over them:
On the User search page, select the people for whom you wish to see account details and click the Get reports for selected users button. You are taken into the Reports section.
Click the Configure report button.
Report type: Select “User details”.
From: Choose your start date.
To: Choose your end date or leave it at today’s date.
Columns: Select additional columns to display more information if you wish.
Click the Submit button.
The report shows the information for the selected users.
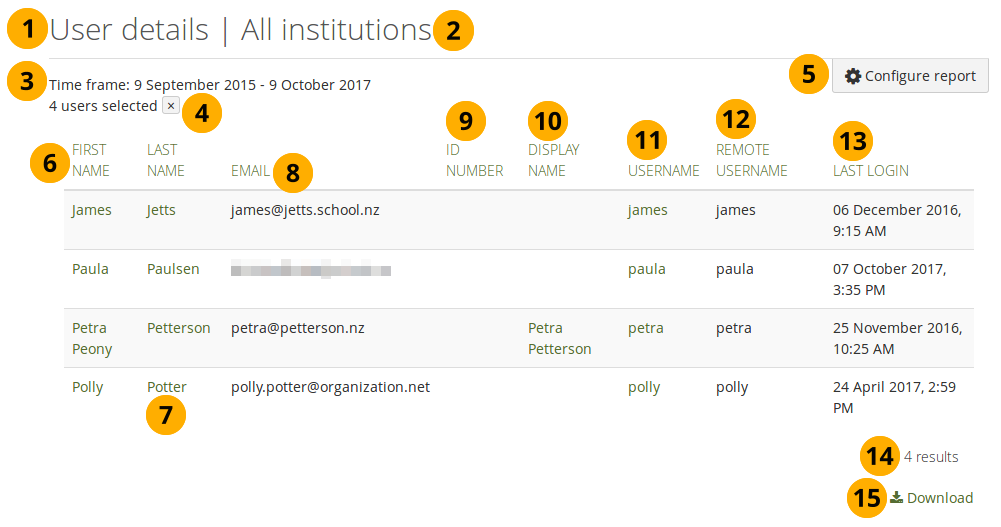
Institution that was selected for the report. If it says “All institutions”, then the report is over the entire site.
Time frame over which is being reported.
Number of selected users for the report if it is not over an entire institution. Click the Remove filter button to report over all people in the chosen institution.
Click the Configure button to change the report settings.
First name: First name of the user.
Last name: Last name of the user.
Email: Email address of the user.
ID number: ID number of the user if one was given.
Display name: If the user chose to set a display name, it is displayed here.
Username: Username of the user.
Remote username: If the user has an authentication method that requires a remote username, it is listed here.
Last login: Date and time when the user was in their account last.
Total number of results.
Click the Download icon to download the report as CSV file.
 Quota used